Total funding 2015-16
London local government received approximately £22.2 billion of funding to spend on local services, capital programmes and maintaining and investing in local authority housing (HRA). This bubble chart shows how London local government was funded in 2015-16.
Click the image to expand
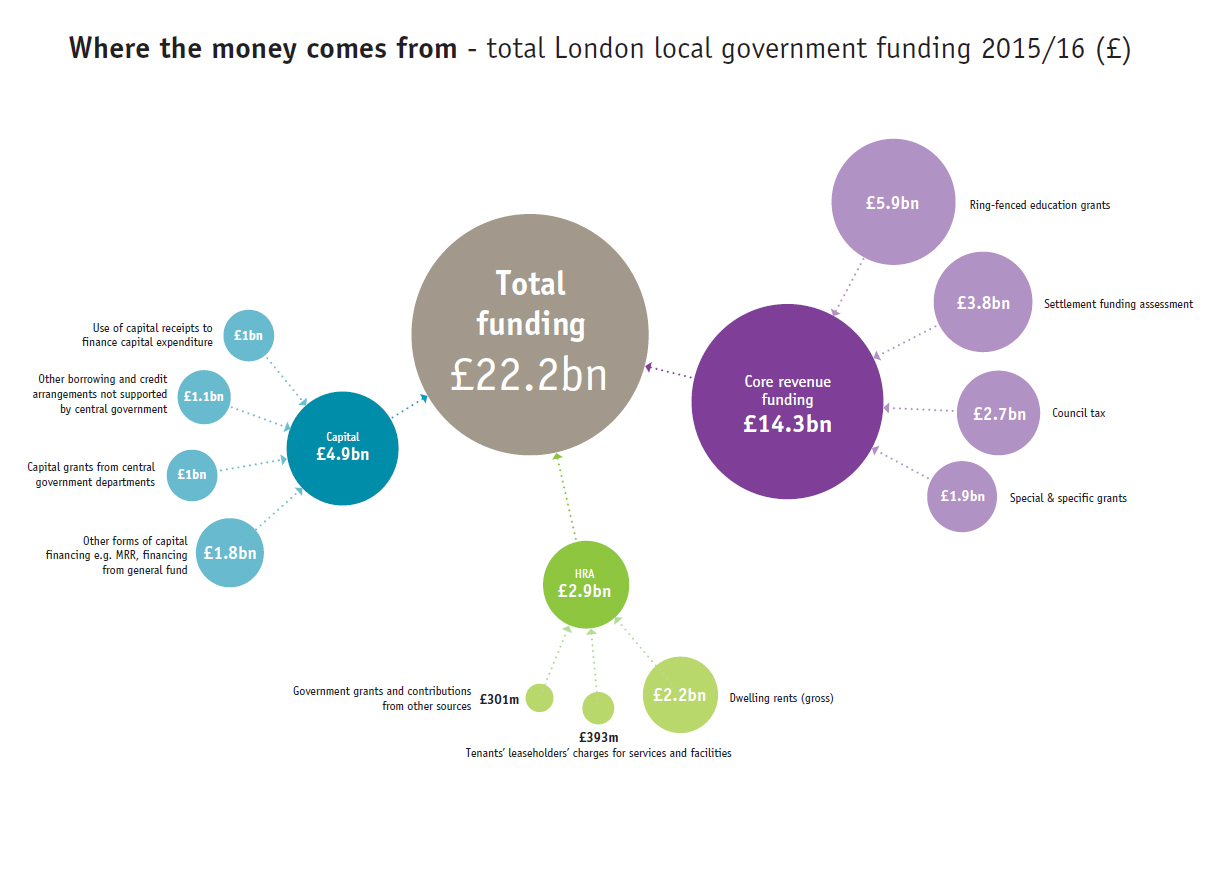
London boroughs’ revenue funding is equal to £14.3 billion, including £5.9 billion ring-fenced Education grants. Settlement funding assessment represents £3.8 billion. The remaining revenue funding is special and specific grants (£1.9 billion) and council tax (£2.7 billion).
London boroughs’ capital funding totals £4.9 billion in 2015-16. Of this, £1 billion is funded through capital grants from central government departments and a further £1.8 billion from other sources such as the Major Repairs Reserve (MRR). Other borrowing not supported by central government represents £1.1 billion and capital receipts make up £1 billion.
Total Housing Revenue Account (HRA) funding in London is equal to £2.9 billion. Dwelling rents make up a substantial proportion of this (£2.2 billion) with tenants’ leaseholders’ charges for services and facilities (£393 million) and government grants and contributions from other sources (£301 million) making up the remainder.
Total expenditure 2015-16
The second chart shows how London local government has budgeted to spend a total of £21.9 billion in 2015-16. Revenue spending on day-to-day services represents £14 billion (63%) of total expenditure, while capital expenditure on infrastructure such as housing and education makes up £4.8 billion (21%). HRA expenditure is equal to £2.9 billion (13%) of total expenditure.
Click the image to expand
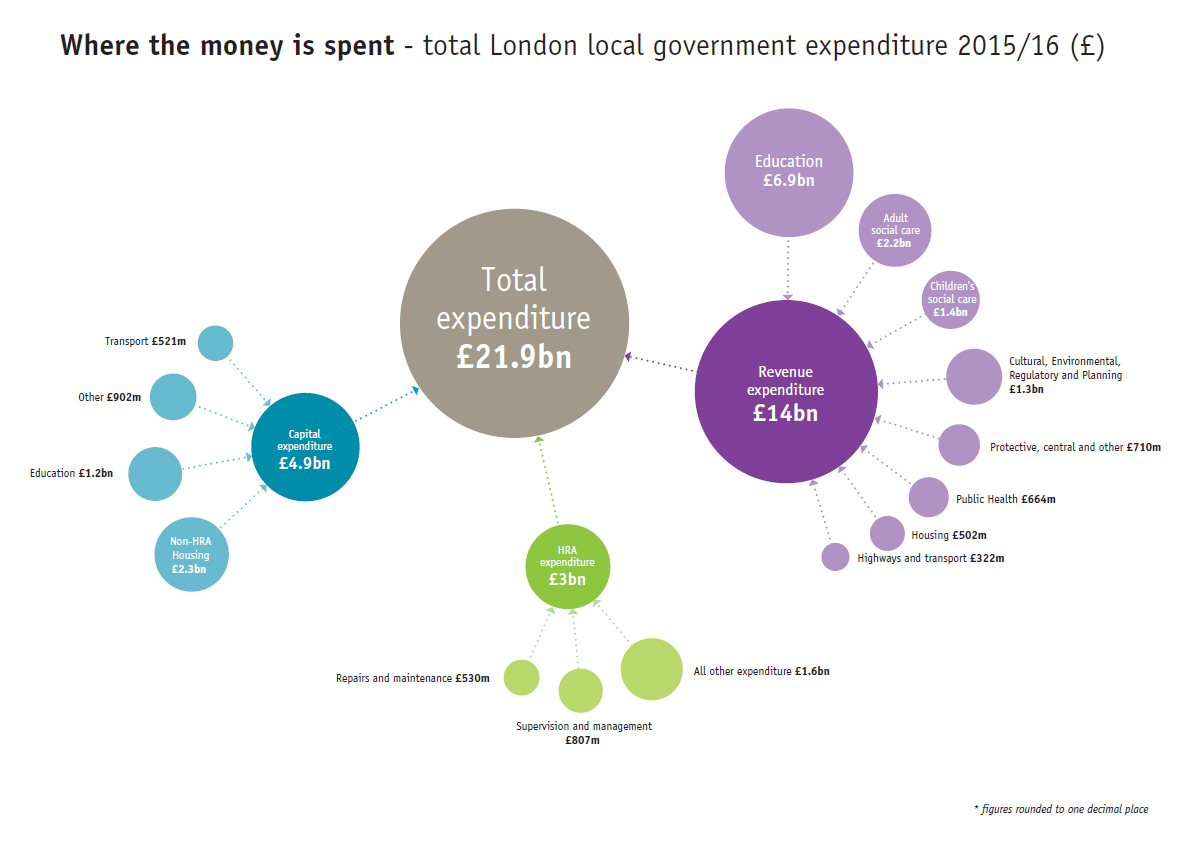
The largest area of revenue expenditure is education (£6.9 billion). Adult and children’s social care together represent £2.2 billion of total expenditure.
See London Councils' detailed service breakdown of the proportion of revenue expenditure.
Capital expenditure is divided between £2.3 billion of spending on Non-HRA; 1.2 billion on education; around £521 million on transport; and just over £902 million in other areas.
Of the £3 billion spent on the Housing Revenue Account, around £807 million is spent on Supervision and management, while Repairs and maintenance account for almost £530 million. A further £1.6 billion is spent in other areas within the HRA.